You can readily find both sides of the ongoing MCAS debate, a debate that has been ongoing for 30 years now. Like many—most? all?—other states, Massachusetts has a threshold score on a set of standardized tests as one of its high-school graduation requirements. But why is this a requirement?
First, let’s clear up what “MCAS” stands for, as you’ll just be confused if you google it. In this context, it’s not “Mast Cell Activation Syndrome,” nor is it “Maneuvering Characteristics Augmentation System.” Here we’re talking “Massachusetts Comprehensive Assessment System.”

OK, so why is there still a debate after 30 years? The answer is (at least) four-fold:
- Ever since the beginning, scores have correlated more with socioeconomic status than with anything else.
- The tests, especially the one administered in tenth grade, are supposed to show whether a student is ready for college. But why can’t a student be allowed to graduate from high school without moving on to college? And why don’t grades 11 and 12 count?
- The testing itself—as well as, in many schools, the prep for it—takes up big chunks of valuable class time, all in the name of improving learning.
- The pandemic made it hard to administer standardized tests and also lowered the averages in most communities.
Renewed interest in MCAS was sparked by a recent increase in the minimum score required for graduating, as well as by the release of scores by city and town. The increased minimum is something of a red herring, as the Massachusetts Board of Elementary and Secondary Education can and does alter the scale from year to year: scaled scores can range from 440 to 560 (don’t ask), where the current threshold is 472 for English, 486 for math, and 470 for science; the Board has raised the English threshold from 472 to 486, thereby matching math. The math and science thresholds are unchanged. It’s not clear what these scaled scores can possibly represent, as the questions can be arbitrarily harder or easier every year, and the raw-to-scaled conversion also varies. As an experienced test writer and grader, I can assure you that I can create a geometry test, for instance, on which the average score will be 90% and another one on which the average score will be 20%, depending on what outcome you desire. See what I wrote on Cut Scores seven years ago.
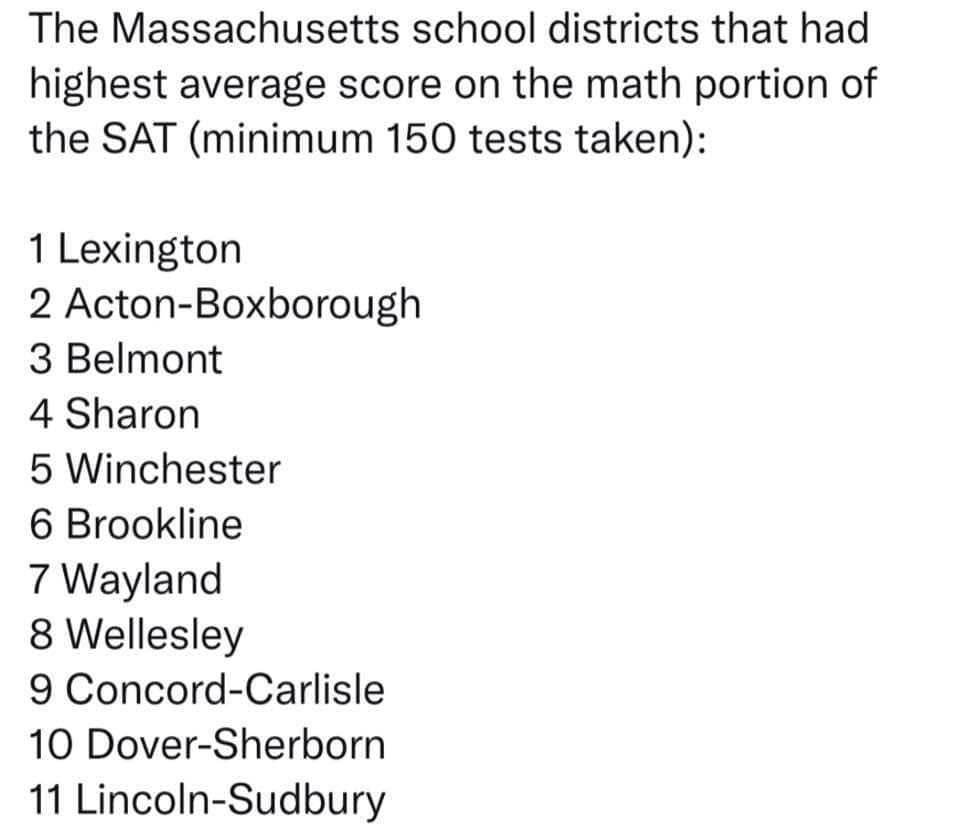
I’ve written a lot about MCAS before (just search for MCAS above in the search bar for this blog). Consider, for instance, a post on MCASitis in this blog from 14 years ago, or the link in the previous paragraph. The correlation with economic status is a little more complicated, but I recommend these articles for commentary that is more qualitative than quantitative. Or, if you want numbers, look at the math or science results from almost any year, and you’ll see something like this list (which actually shows math SAT scores, but the MCAS scores are similar):
Categories: Teaching & Learning
