According to Pew, the average adult reads — wait! median adult or mean adult?— OK, the median adult reads 12 books per year, whereas the mean is only 4. Ponder that discrepancy for a minute!
We all know — though some of us might have forgotten — that the median and the mean are different kinds of “averages,” though only the mean matches the traditional definition of “average.” When I ask students which statistic gives a better picture of the typical person (in a different context, not book-reading), most of them prefer the mean. Suppose the context is quiz grades, not numbers of books; my students’ justification for preferring the mean is often something like “the median only tells you about one quiz, but the mean tells you about the whole quarter.” Or sometimes it’s “because that’s how my teacher calculates my average.”
Both of these explanations are unacceptable. The second one, which is an appeal to authority, is not a justification at all. The first one is just plain wrong. Actually it’s the mean that tells you about only one quiz, and it might not even be a real quiz. For instance, consider the following quiz grades (sorted numerically): 92, 90, 89, 86, 85, 85, 12. The mean is 77 and the median is 86. Clearly 86 gives a good picture of the typical quiz grade, but 77 is nearly worthless. Six of the seven grades are above that mean, and no quiz score is anywhere near 77. Whatever “typical” might mean, there is no way that 77 is typical in this distribution.
Some teachers solve this problem by throwing out the highest and lowest scores and then using the mean of the remaining ones. This would give us an “average” of 87 for this set of quiz scores, and 87 is pretty reasonable, but there are two reasons why I don’t like that method:
- If each quiz assesses a slightly different set of skills and concepts, the throwing-out system sends the unintended message that there’s no need to learn what’s on two of the quizzes. That’s bad. If it’s important, assess it!
- If a student has worked hard to earn a particularly high grade on one specific quiz, how do they feel when that grade is thrown out? An exceptionally low grade might be an outlier caused by bad lack or illness — maybe you’re having a bad day — but an exceptionally high grade must be due to hard work or deep understanding.
My compromise for many years has been to calculate the mean but give students a second chance: the opportunity to “retake” any quiz or test with a low grade (except the final). The retake, of course, consists of entirely new problems, but ones that test the same skills and concepts. This is not a perfect solution, but it works reasonably well.
What does all this have to do with how many books you read? Not much, I must admit; it’s easy to get distracted when we’re cooped up inside all day. So let’s return to the topic at hand.
I was somewhat shocked, I have to admit, by Pew’s results. A median of four books in a year???? But an aggregate result, whether median or mean, doesn’t tell us a whole lot, so let’s disaggregate the data. Pew, of course, being Pew, has done that for us when presenting the statistics:
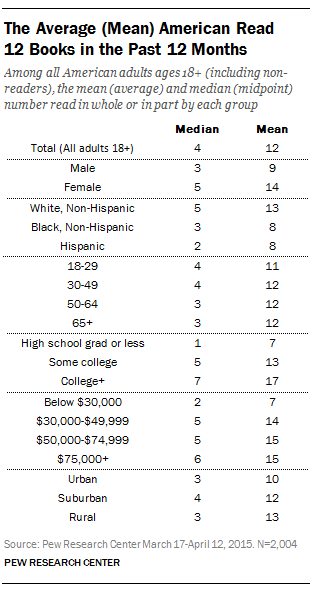
Your observations may vary, but here are a few facts that stood out for me without deeper analysis:
- Women read more than men. (No surprise there.)
- Age doesn’t matter. (Some will be quite surprised to see this, since they think that young people don’t read.)
- Education matters a lot. (Correlation, not causation. Which way does the causation flow?)
- Income matters. (But only as a binary split.)
- Coming back to the mean/median distinction that started this discussion, we see that the distributions are skewed. (Means are far higher than medians, showing us that a small number of people read a huge number of books. I plead guilty.)

Categories: Books, Math, Teaching & Learning
