Interactive historical local maps! Interactive historical local maps!
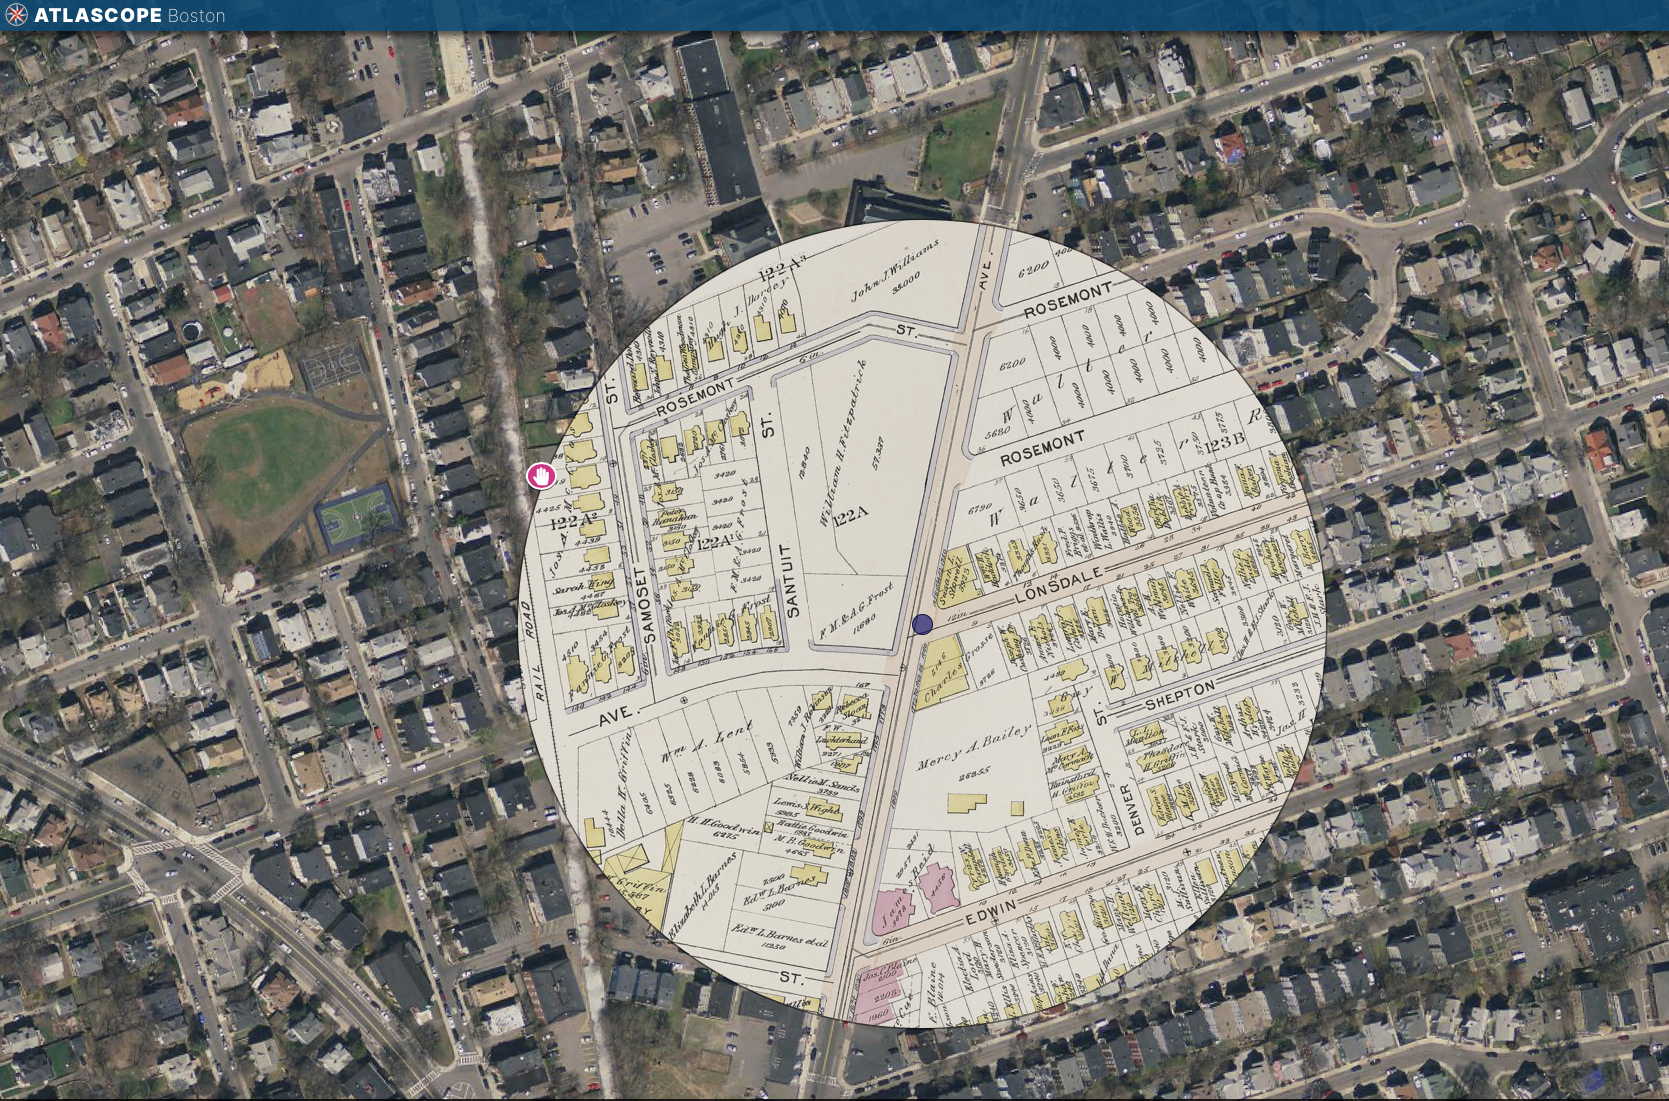
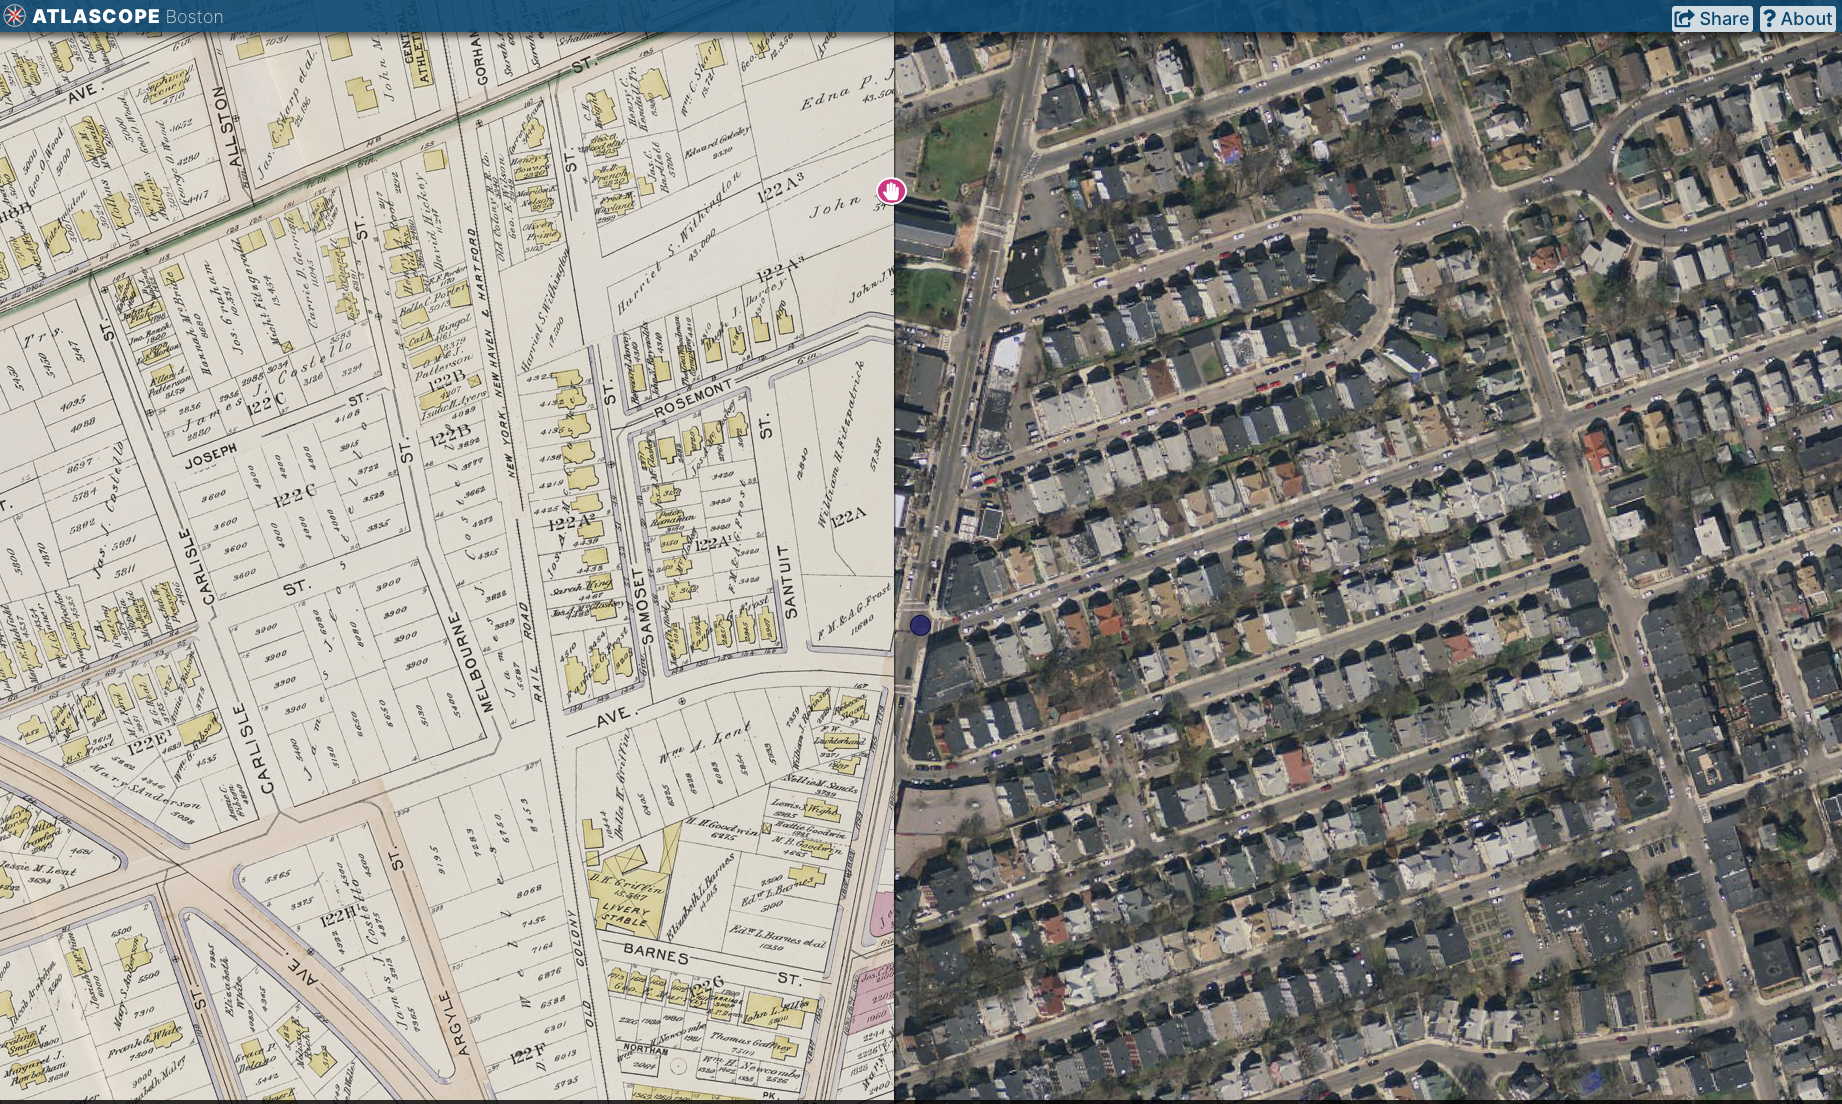
Yesterday I attended a fascinating workshop at the Boston Public Library (JP branch), where we explored their new home-brewed web-based software for dynamically viewing historical changes in local maps and used it to trace some local JP history, such as the path of Stony Brook above and below ground. Give it a try! The interface is not 100% intuitive, but it’s quick to learn and you’ll get the hang of it with no trouble. As you’ll see in the screenshots below, the old map view is overlaid perfectly on a modern map, so you can compare the two. You can select from various old atlases and of course you can pan and zoom. If you don’t like the aerial photo that I have chosen, you can do a street map instead.
Maps have fascinated me since I was a small child. To me they are a great example of applied mathematics: a useful model of selected quantitative features of the real world. A few years ago I wrote an essay in which I mused about what some of my academic interests have in common — including cartography — and the Atlascope software certainly feeds that passion. The workshop was ably run by the designers of that software, Garrett Dash Nelson and Belle Lipton, of the Leventhal Map & Education Center at the BPL. They will be giving more Atlascope workshops in the future, featuring various Boston neighborhoods, so sign up for one when they become available. I also notice a lot of other interesting-sounding events in their calendar, so I’ll have to check some out.
Categories: Dorchester/Boston, Teaching & Learning
